Perplex
Content
  • Exponents & Logarithms
  • Approximations & Error
  • Sequences & Series
  • Counting & Binomials
  • Proof and Reasoning
  • Complex Numbers
  • Cartesian plane & lines
  • Quadratics
  • Function Theory
  • Transformations & asymptotes
  • Polynomials
  • 2D & 3D Geometry
  • Trig equations & identities
  • Vectors
  • Probability
  • Descriptive Statistics
  • Distributions & Random Variables
  • Differentiation
  • Integration
  • Differential Equations
  • Maclaurin
Other
  • Review Videos
  • Blog
  • Landing Page
  • Sign Up
  • Login
  • Perplex
    IB Math AAHL
    /
    Descriptive Statistics
    /

    Problem Bank

    [Maximum mark: 14]

    The Rwandan Department of Agriculture is studying the mass of potatoes grown in the country. A researcher visits ​8​ different farms (A-H) and weighs a random sample of ​40​ potatoes at each farm. He uses a scale that records mass to the nearest ​10​ grams. The data is summarized in the following parallel box and whisker plot.

    <p>Observed features from the box-and-whisker plot (values read approximately from the Mass (g) axis):</p><ul><li><p>A:</p><ul><li><p>Q1 ≈ 200 g, Median ≈ 230 g, Q3 ≈ 260 g</p></li><li><p>Whiskers: ≈ 170 g to ≈ 280 g</p></li><li><p>Outliers: none visible</p></li></ul></li><li><p>B:</p><ul><li><p>Q1 ≈ 210 g, Median ≈ 240 g, Q3 ≈ 250 g</p></li><li><p>Whiskers: ≈ 180 g to ≈ 270 g</p></li><li><p>Outliers: none visible</p></li></ul></li><li><p>C:</p><ul><li><p>Q1 ≈ 190 g, Median ≈ 210 g, Q3 ≈ 220 g</p></li><li><p>Whiskers: ≈ 170 g to ≈ 260 g</p></li><li><p>Outliers: ≈ 270 g, ≈ 280 g</p></li></ul></li><li><p>D:</p><ul><li><p>Q1 ≈ 200 g, Median ≈ 230 g, Q3 ≈ 240 g</p></li><li><p>Whiskers: ≈ 170 g to ≈ 270 g</p></li><li><p>Outliers: none visible</p></li></ul></li><li><p>E:</p><ul><li><p>Q1 ≈ 200 g, Median ≈ 210 g, Q3 ≈ 240 g</p></li><li><p>Whiskers: ≈ 180 g to ≈ 260 g</p></li><li><p>Outliers: ≈ 290 g</p></li></ul></li><li><p>F:</p><ul><li><p>Q1 ≈ 210 g, Median ≈ 230 g, Q3 ≈ 240 g</p></li><li><p>Whiskers: ≈ 170 g to ≈ 270 g</p></li><li><p>Outliers: ≈ 150 g</p></li></ul></li><li><p>G:</p><ul><li><p>Q1 ≈ 230 g, Median ≈ 250 g, Q3 ≈ 260 g</p></li><li><p>Whiskers: ≈ 190 g to ≈ 270 g</p></li><li><p>Outliers: ≈ 170 g</p></li></ul></li><li><p>H:</p><ul><li><p>Q1 ≈ 200 g, Median ≈ 240 g, Q3 ≈ 250 g</p></li><li><p>Whiskers: ≈ 190 g to ≈ 260 g</p></li><li><p>Outliers: none visible</p></li></ul></li></ul><p>Additional visible elements:</p><ul><li><p>Vertical axis labeled “Mass (g)” with gridlines; approximate range shown is 150 g to 300 g.</p></li><li><p>Outliers marked with asterisks.</p></li></ul>

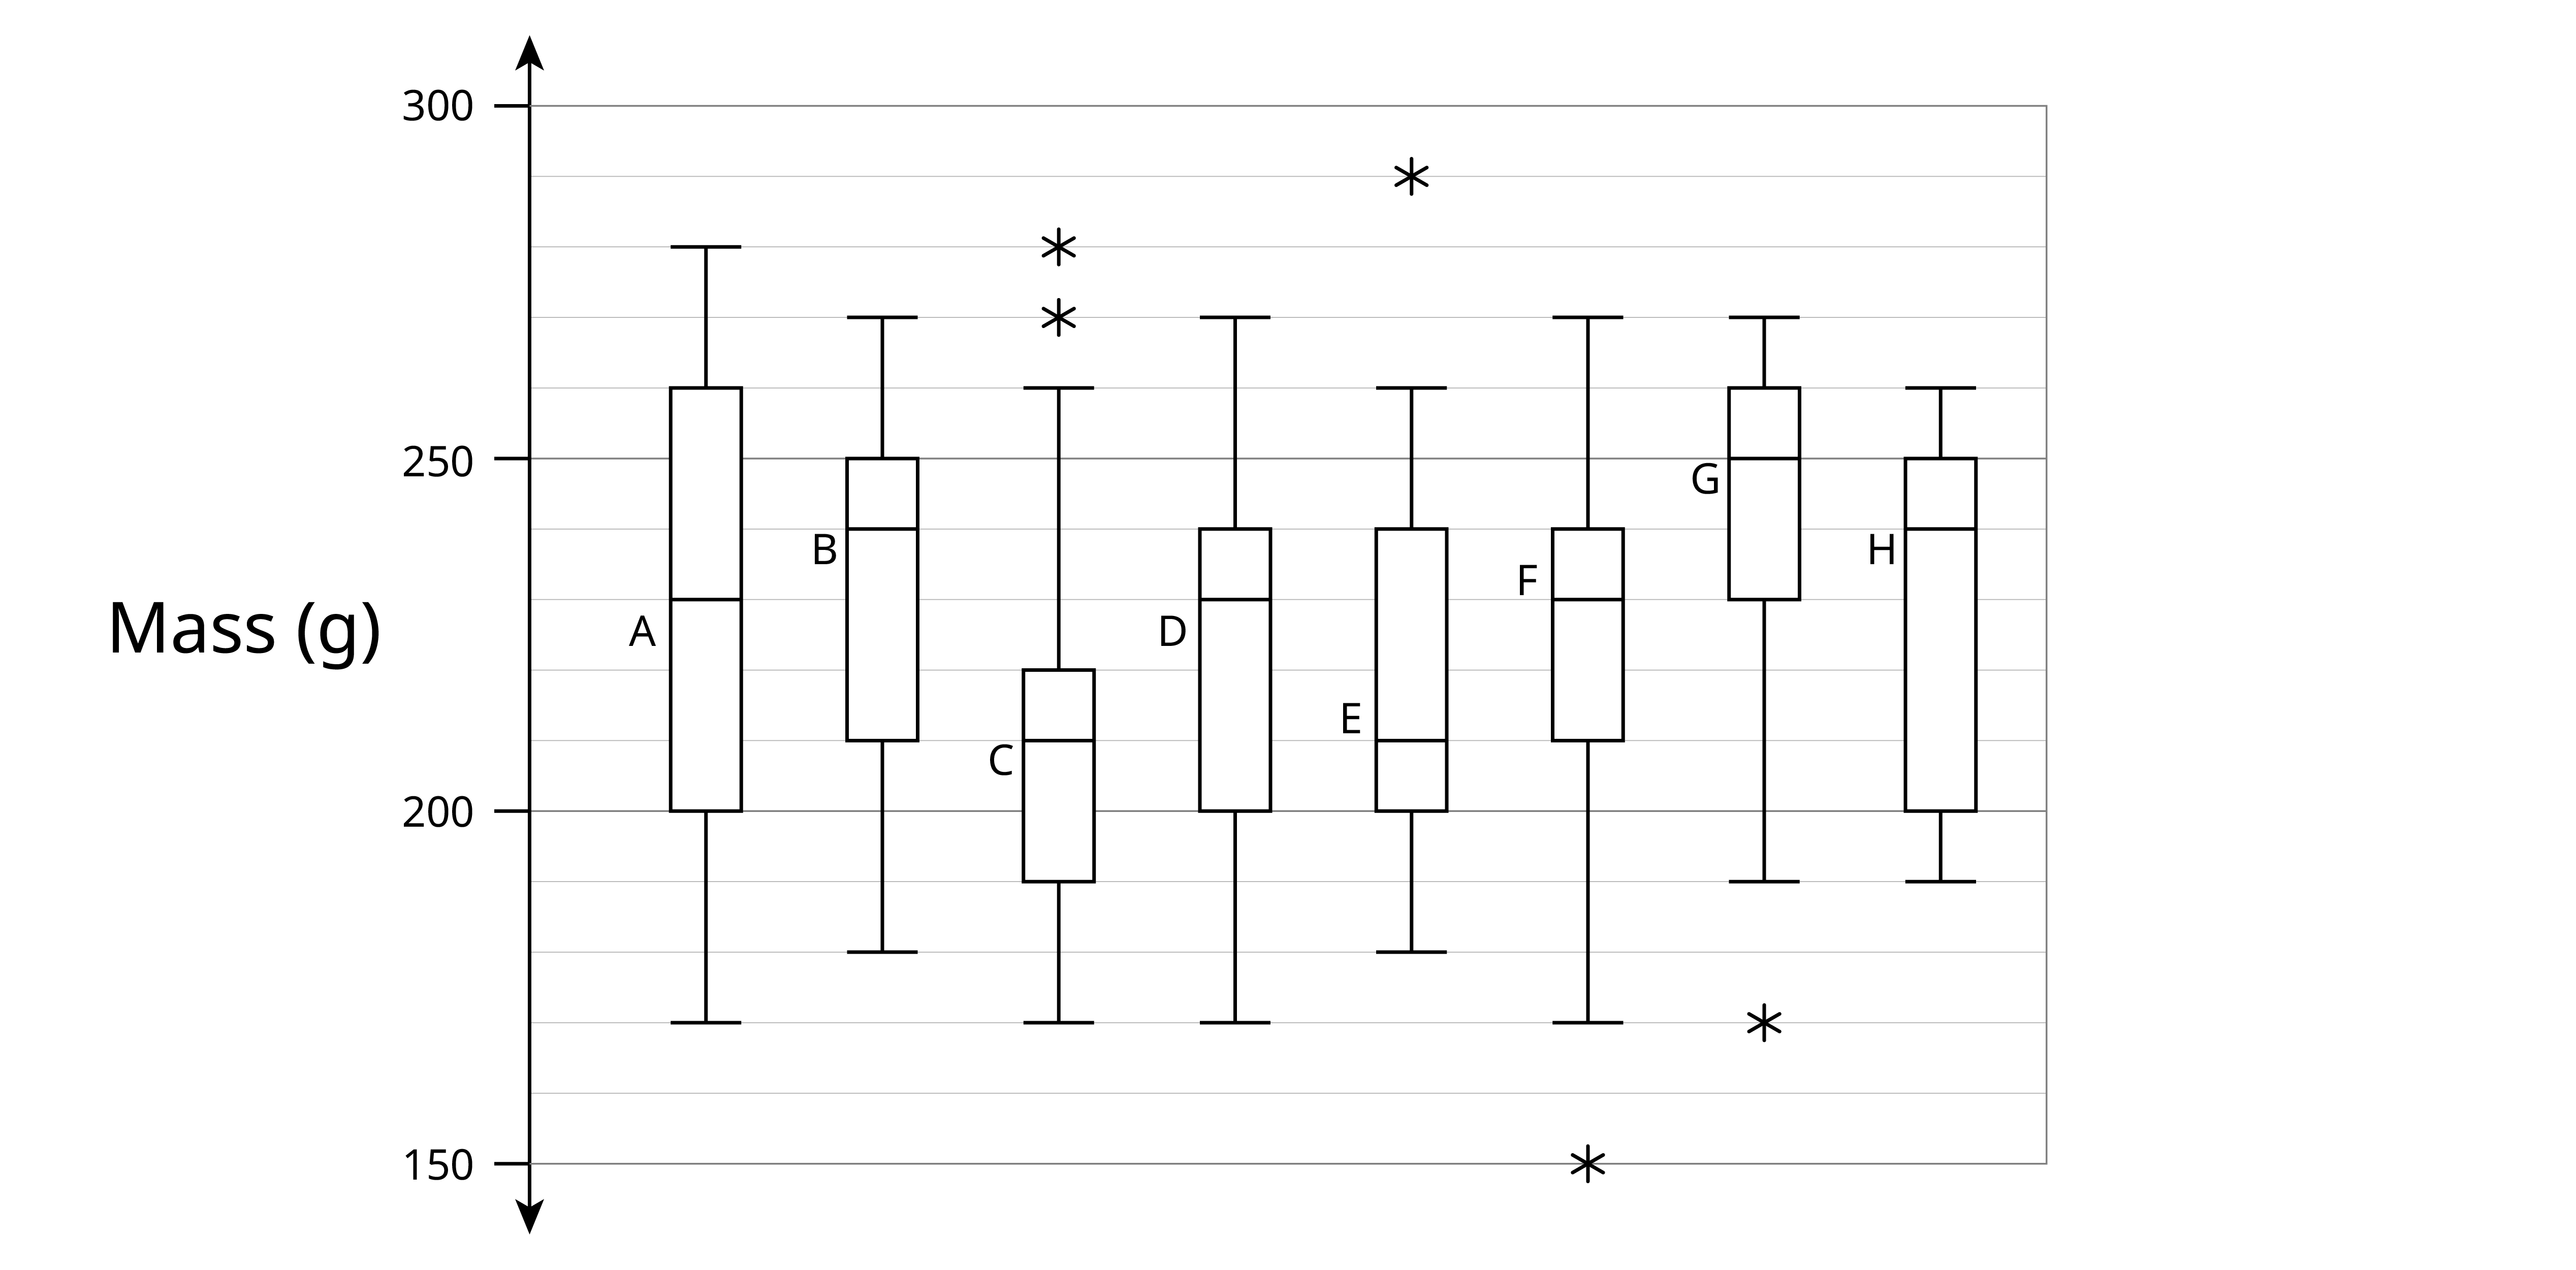
    Each star on the diagram represents a single outlier.

    1. Find the farm with and the value of

      1. the highest median,

        [1]

        To earn a crown, get your answer ready before you reveal the options!

      2. the largest interquartile range.

        [2]

    The number of potatoes whose recorded mass ​m​ satisfies ​160≤m≤280​ is ​n.

    1. Find the value of ​n.

      [3]
    2. The recorded masses of potatoes from all ​8​ farms are arranged in increasing order in a list ​L. Find

      1. the ​6th​ element in ​L,

        [1]
      2. the possible value(s) of the ​316th​ element in ​L.

        [3]

    A potato with mass ​x​ would be considered an outlier at any of the farms the researcher visited.

    1. Determine the range of possible values of ​x.

      [4]

    Ask Plex AI about this problem

    Get hints, ask questions, and work through this problem step by step

    I'm Plex, here to help with problems on this worksheet!