Topics

Measuring Center
0 of 0 exercises completed
Learn different ways to measure the "center," or typical values, of a set of data: mean, median, and mode.
Want a deeper conceptual understanding? Try our interactive lesson!
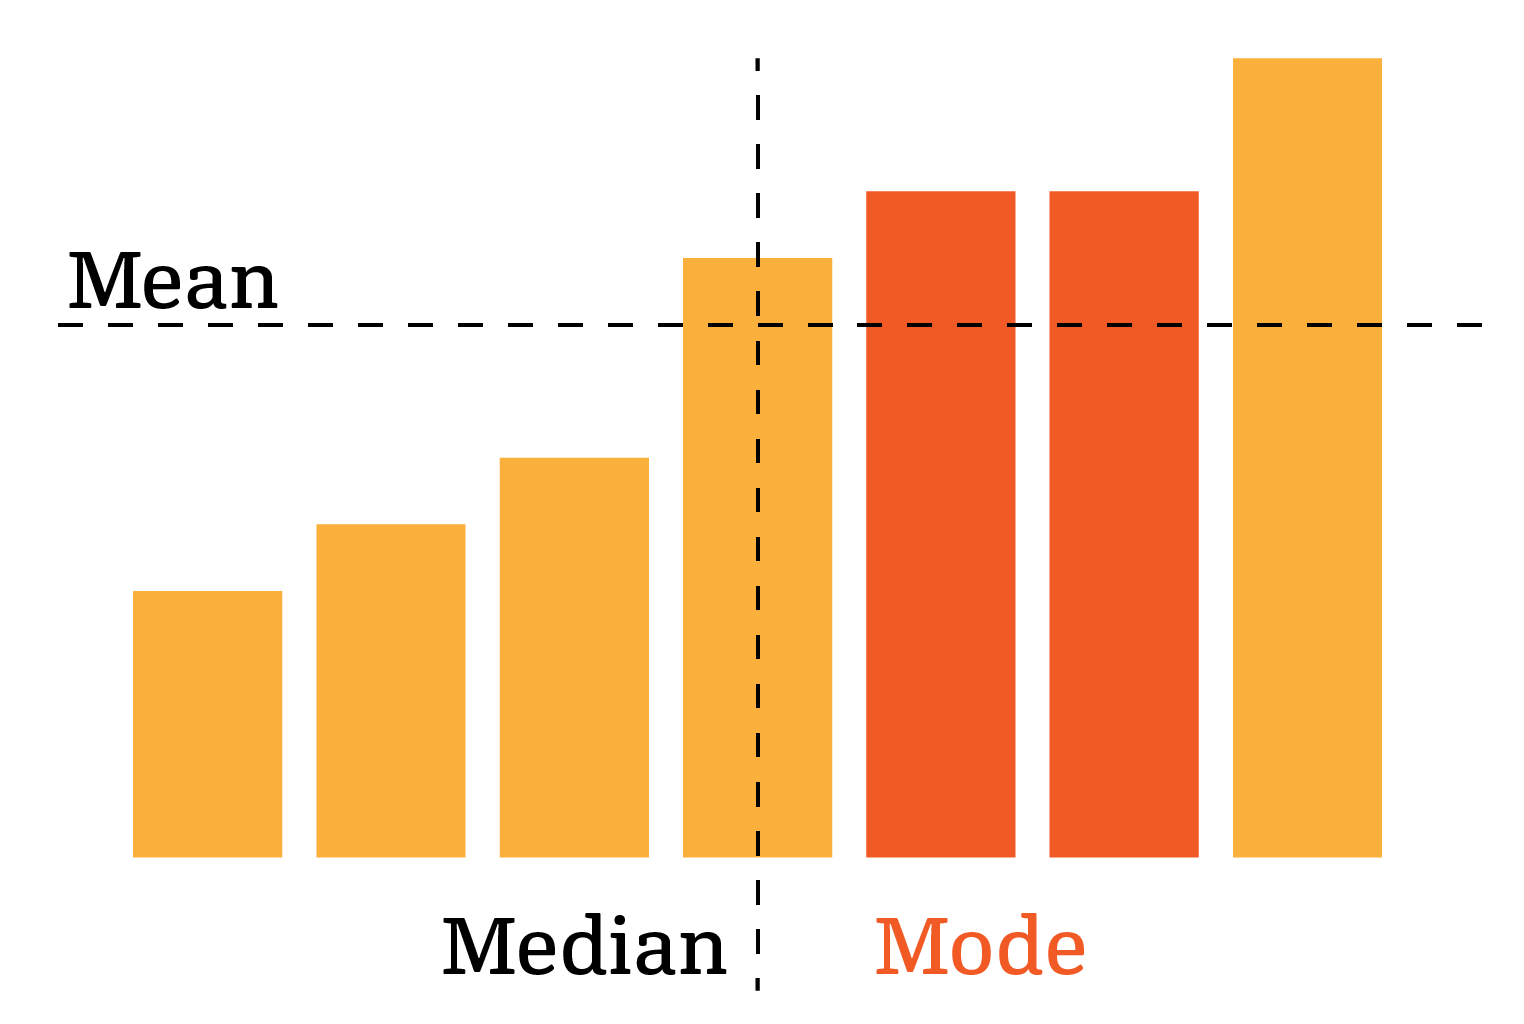
Mean
SL 4.3
The mean of a numerical dataset is the average of all the values:
xˉ=number of valuessum of values🚫
The mean is also sometimes denoted μ.
Median
SL 4.3
The median of a dataset is the middle value when the values are sorted. If a dataset has an even number of values, the median is the average of the middle two.
Mathematically, the median is the
2n+1th🚫
value. Notice that if n is even then 2n+1 is halfway between two consecutive integers, indicating we need to average their values.
Mode
SL 4.3
The mode of a dataset is the most common value in a dataset.
Nice work completing Measuring Center, here's a quick recap of what we covered:
Skills covered
Exercises checked off
I'm Plex, here to help you understand this concept!