Topics
The last application of the t-test on IB exams is testing whether there exists a correlation between two normally distributed random variables. If we have a sample of points (x,y) from X∼N(μx,σx2), Y∼N(μy,σy2), we can calculate the correlation coefficient r. A strong correlation in a large enough sample is strong evidence that the populations are correlated.
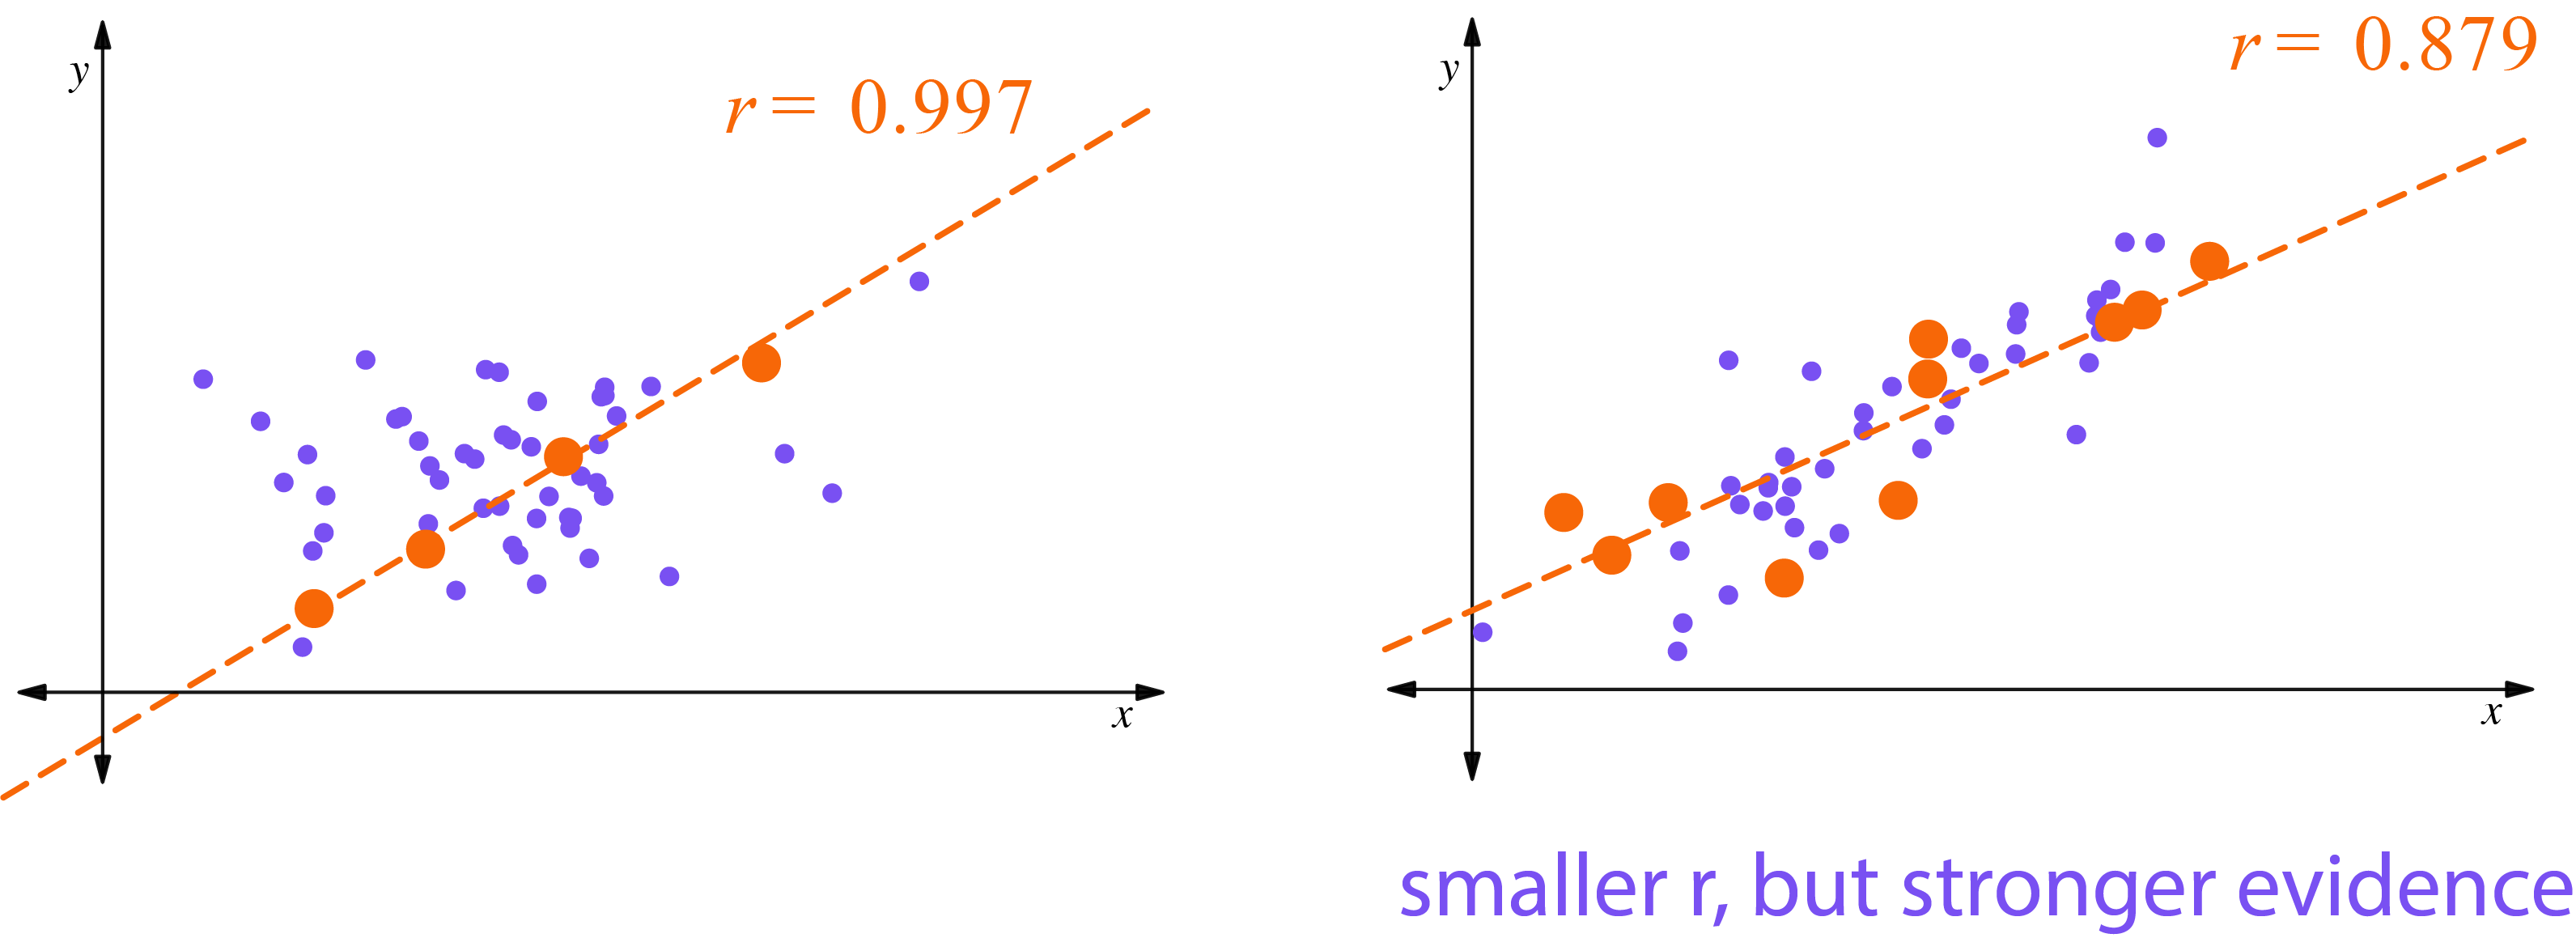
Basically, calculating r from a sample alone does not indicate how confident we can be that the underlying populations are correlated. If a small sample of (x,y) seems correlated, it could just be a coincidence.
This sounds abstract, so here is an example. The brightness of a star is correlated with the temperature at the surface of the star. By looking at a large enough number of stars, we can confidently conclude the population (all start in a certain temperature range) are correlated.
Note: This is not real data, but illustrates a real correlation.
We call the true correlation between the populations ρ, and r is only an estimate of ρ. Technically, r is a biased estimate of ρ, but all you need to know is that as the sample size goes to infinity, r→ρ.
What we want is a test that combines the strength of the sample correlation r with the size of the sample. This is what the LinRegTTest on your calculator does.