Topics

Quartiles and Box & Whisker Plots
0 of 0 exercises completed
Learn the concept of dispersion, range, IQR, outliers, and box and whisker plots.
Want a deeper conceptual understanding? Try our interactive lesson! (Plus Only)
Range
SL 4.3
Range is the difference between a dataset's minimum and maximum values.
Though range may give a sense of the dispersion of a set, outliers will always have a strong effect on range since they pull the minimum or maximum values far from the rest of the data.
Quartiles
SL 4.3
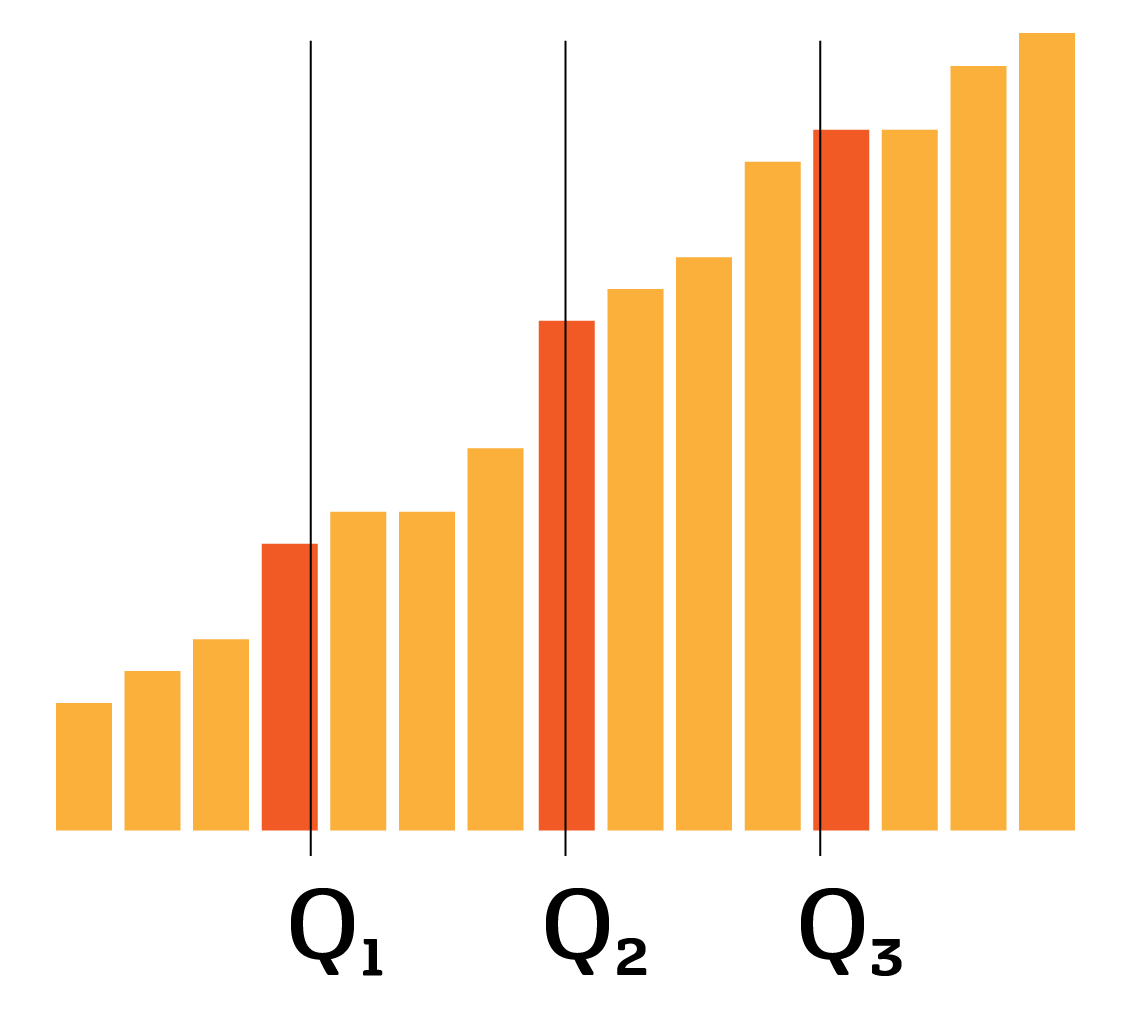
Quartiles are conceptually similar to the median, except that there are three of them: Q1,Q2 and Q3, dividing the sorted dataset into 4 equal-size parts.
Q2 is the median, dividing the datapoints in two.
Q1 is halfway between the first value and the median.
Q3 is halfway between the median and the last value.
Interquartile Range & Outliers
SL 4.3
The interquartile range, denoted IQR, is the difference between the third and first quartile:
IQR =Q3−Q1
A value x in a dataset is said to be an outlier if x<Q1−1.5×IQR or x>Q1+1.5×IQR.
Box & Whisker Plots
SL 4.2
A box-and-whisker plot visually summarizes data by splitting it into quarters. The box shows the middle 50% of your data (from Q1 to Q3), and the line inside marks the median. The whiskers extend to show the spread of data, excluding outliers, which are marked with a cross.
- Minimum: smallest value (left whisker end)
- Lower Quartile (Q1): median of lower half (25% mark)
- Median (Q2): middle value of data set
- Upper Quartile (Q3): median of upper half (75% mark)
- Maximum: largest value (right whisker end)
Nice work completing Quartiles and Box & Whisker Plots, here's a quick recap of what we covered:
Skills covered
Exercises checked off
I'm Plex, here to help you understand this concept!