Perplex
Content
  • Exponents & Logarithms
  • Approximations & Error
  • Sequences & Series
  • Matrices
  • Complex Numbers
  • Financial Mathematics
  • Cartesian plane & lines
  • Function Theory
  • Modelling
  • Transformations & asymptotes
  • 2D & 3D Geometry
  • Voronoi Diagrams
  • Trig equations & identities
  • Vectors
  • Graph Theory
  • Probability
  • Descriptive Statistics
  • Bivariate Statistics
  • Distributions & Random Variables
  • Inference & Hypotheses
  • Differentiation
  • Integration
  • Differential Equations
Other
  • Review Videos
  • Formula Booklet
  • Blog
  • Landing Page
  • Sign Up
  • Login
  • Perplex
    IB Math AIHL
    /
    Inference & Hypotheses
    /

    Problem Bank

    [Maximum mark: 8]

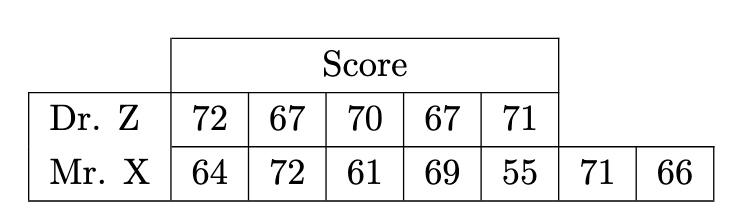
    Dr. Z thinks his class performed better on a recent exam than Mr. X's class. The scores of students in each class are displayed in the following table:

    <ul>
<li>A two-row table with gridlines. The top has a merged header cell labeled “Score” spanning five columns.</li>
<li>Row labels at the left: “Dr. Z” and “Mr. X.”</li>
<li>Dr. Z row contains five scores under the header: 72, 67, 70, 67, 71.</li>
<li>Mr. X row contains seven scores: 64, 72, 61, 69, 55, 71, 66. The last two cells extend beyond the span of the “Score” header.</li>
</ul>

    Dr. Z decides to conduct a ​t​-test at the ​10%​ significance level.

    1. Write down the null and alternative hypotheses for this test.

      [1]

      To earn a crown, get your answer ready before you reveal the options!

    2. Determine with justification the conclusion of this test.

      [5]
    3. State the two assumptions Dr. Z makes in using a ​t​-test.

      [2]

    Ask Plex AI about this problem

    Get hints, ask questions, and work through this problem step by step

    I'm Plex, here to help with problems on this worksheet!