Topics

Student's t-test
0 of 0 exercises completed
Student's t-tests for comparing means in the 1-sample, 2-sample and paired cases, as well as the assumptions made by the test.
Want a deeper conceptual understanding? Try our interactive lesson!
1 tailed and 2 tailed T-tests and their hypotheses
SL AI 4.11
A T-test is a technique that compares whether the means of two groups are significantly different. It works by measuring how different the mean of a sample is from another mean, and comparing that difference to the variance in the sample.
The null hypothesis is that the two groups have the same mean H0:μ=μ0.
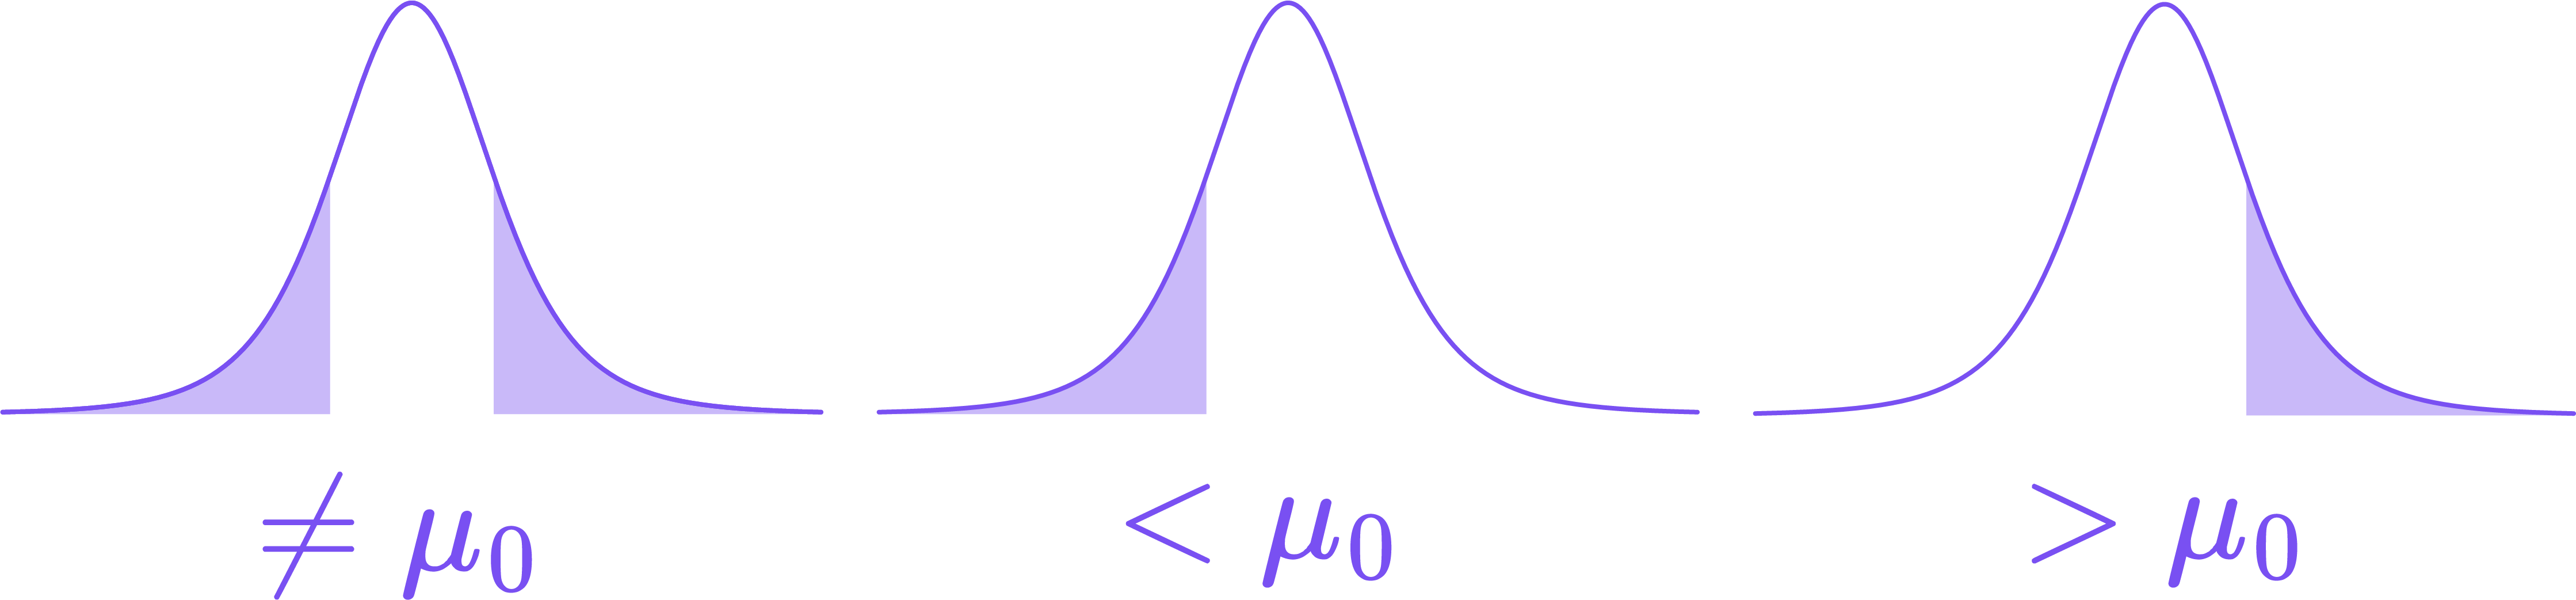
We can have any of the following alternative hypotheses:
H1:μ<μ0 - testing whether our sample has a lower mean that what we're comparing it to
H1:μ>μ0 - testing whether our sample has a higher mean that what we're comparing it to
H1:μ=μ0 - testing whether our sample has a different mean that what we're comparing it to
The first two alternative hypotheses are called one-tailed because they test difference in a specific direction (one mean greater or smaller than the other).
Examples
We can use a one-tailed T-test to determine whether
patients at a certain hospital have a significantly faster (lower) mean recovery time than the national average. This is a one-tailed test.
trout in lake A have a significantly different mean weight than trout in lake B. This is a two-tailed test.
Example
A researcher wants to know if boys on the school soccer and basketball teams are taller than the average boy in the school. The mean height of all boys in the school is 175cm, and the mean height on each team is 180cm. However, the variance in height on each team is not the same:
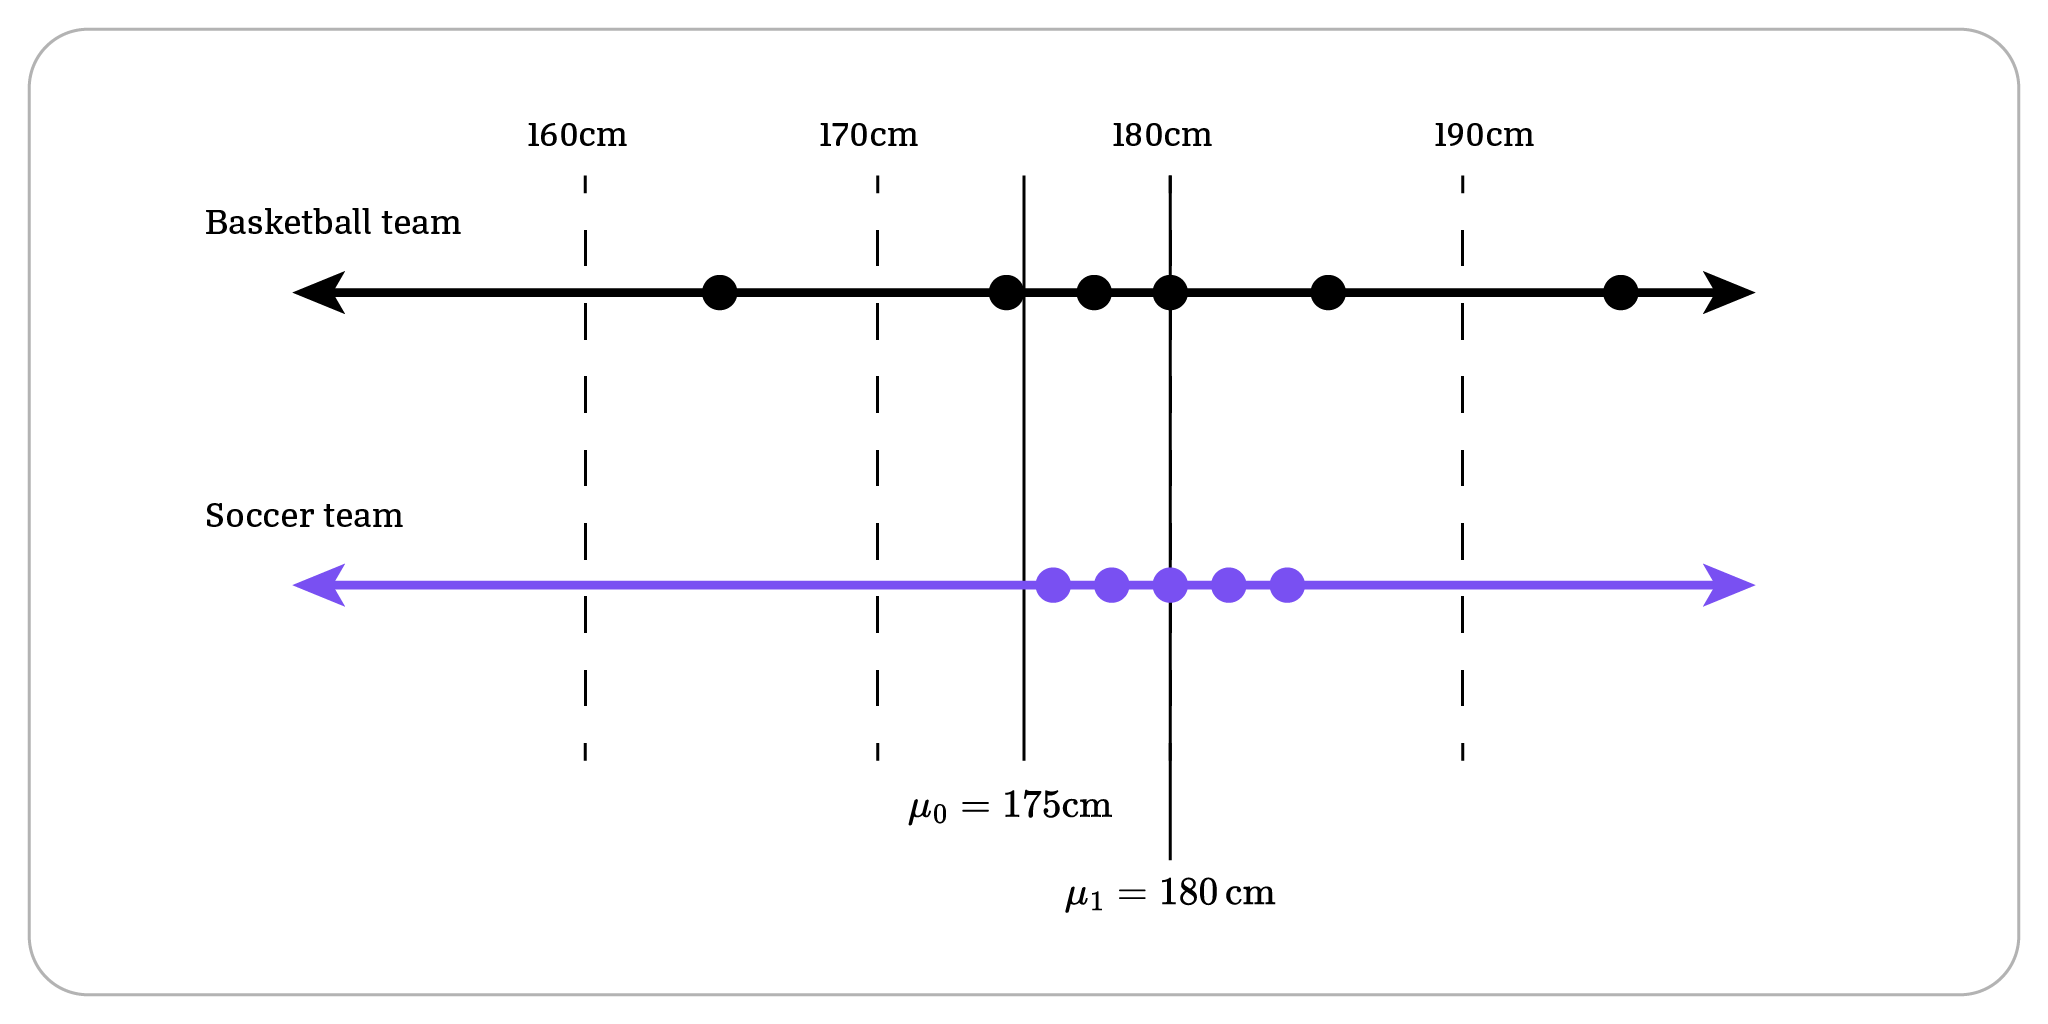
The data shows that boys on the soccer team are have more consistent heights. Because the heights on the soccer team are less "random" and more compact, it is more statistically significant that their mean height is taller.
How does the T-test work?
Under the hood, the calculator computes a t value, which is a measure of how different our sample is from a specified mean, relative to the variance in the sample. It then uses a t-distribution to calculate the probability of getting this t value under chance alone. The smaller that p value, the less likely the null hypothesis is.
T-test for mean μ (1-sample)
SL AI 4.11
We can perform a t-test for a single sample against a known mean by on a calculator:
Enter the sample data into a list.
Navigate to T-Test on a calculator.
Select "DATA" and enter the name of the list where sample is stored.
Select the tail type depending on what our alternative hypothesis is (μ0 is the population mean):
=μ0 for a change in mean
<μ0 for a decrease in mean
>μ0 for an increase in mean
Hit calculate, and interpret the p-value as usual.
Assumptions: This test is assuming that the data are independent, randomly sampled, and approximately normally distributed. IB questions will specifically ask you to state the assumption of normally distributed variables.
2-sample T-Test
SL AI 4.11
To compare the means of two samples using a T-test, we use a calculator:
Enter each sample in its own list.
Navigate to 2-SampTTest.
Select "Data", then enter the names of the lists containing the samples.
Select the tail type depending on what our alternative hypothesis is:
μ1=μ2 for different means
<μ2 for first list mean smaller than second
>μ2 for first list mean greater than second
Set "Pooled" to true.
The calculator reports the t-value and p-value, which we interpret as usual.
Assumptions: This test is assuming that the data are approximately normally distributed, and that both samples have the same variance. IB questions will specifically ask you to state these assumptions.
Paired tests for the mean
AHL AI 4.18
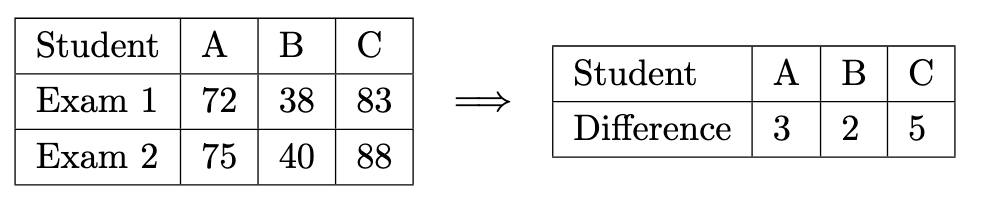
We say that data is paired when each value in one row is tied to the value in the next row. An example of this is before and after scores for a group of students.
Instead of comparing means using a two-sample test, we instead calculate the difference between the rows for each column, and then use a 1 sample T test with μ0=0.
Two important notes:
H0:d=0 and H1 can be d=0,d<0 or d>0.
The assumption being made is that the differences are normally distributed, not the original values.
Nice work completing Student's t-test, here's a quick recap of what we covered:
Skills covered
Exercises checked off
I'm Plex, here to help you understand this concept!