Topics
Skill Checklist
Track your progress across all skills in your objective. Mark your confidence level and identify areas to focus on.
25 Skills Available
Track your progress:
Don't know
Working on it
Confident
📖 = included in formula booklet • 🚫 = not in formula booklet
Track your progress:
Don't know
Working on it
Confident
📖 = included in formula booklet • 🚫 = not in formula booklet
Functions and their properties
5 skills
Function as a mathematical machine
SL Core 2.2
A function is like a mathematical machine, you put in a number and it gives you exactly one number back. If you put in the same number multiple times, you will always get the same number out.
An example of a function is the rule "double the input and add 1".
If you input 3, it doubles to make 6, thenwe add1toget an output of7
If you input −5, it doubles to make −10, thenwe add1toget an output of−9
Expression of a function f(x)
SL Core 2.2
The rule that defines a function is often written in the form
f(x)=somethingthatdependsonx
For example, the function "double the input and add 1" can be written
f(x)=2x+1
Let's break down what this expression says:
The LHS names the function f, and then f(x) means "when you input x into the function f"
The RHS defines the rule, and essentially says "the output is twice the input, plus 1".
Evaluating functions
SL Core 2.2
A function can be evaluated for specific values of x by plugging the value into the expression of the function.
Function diagram
2. Prior learning
A function diagram shows how a set of inputs is mapped to a set of outputs with arrows pointing from inputs to outputs.
Multiple arrows can point to the same output, but each input must have exactly one arrow, since a function always gives the same output for a given input.
Table of function values
2. Prior learning
The inputs and outputs of a function can be represented in a table where one row shows inputs, and the other shows outputs:
To find f(some value), look for that value in the first row, then look at the row below it. For example, f(11)=2.
Function Graphs
12 skills
Graph of a function
SL Core 2.3
The graph is a visual representation of a function made by placing all the points (x,f(x)) on a coordinate plane. Since most functions have infinitely many possible inputs x, the graph often looks like a line.
Finding function values from graph
SL Core 2.2
We can find the value f(a) of a function by looking at the y-value of the graph where x=a:
Vertical line test
SL Core 2.2
To test if a graph represents a function, we use the vertical line test. If any vertical line intersects the graph in two locations, the graph cannot be of a function.
Graphing with technology
SL Core 2.3
When the graph of a function is not known, a calculator can be used to plot its curve. Under the hood, the calculator is simply plotting points at regular x intervals, and connecting them with straight lines. For a small enough interval, this approximation is basically unnoticeable.
Intersections with GDC
SL Core 2.4
Calculators are able to provide precise information on coordinates of an intersection of two functions.
Using a TI-84, 2nd > CALC > INTERSECT,
or using a Casio, SHIFT > G-SOLV > INTSECT
will find an intersection between two functions.
x-intercepts
SL Core 2.4
The x-intercepts of a function are the values of x where the curve intersects the x-axis. Since the x-axis has the equation y=0, this means the function is equal to zero. For this reason, x-intercepts are also often called the "zeros" of the function.
y-intercepts
SL Core 2.4
The y-intercept of a function is the values of y where the curve intersects the y-axis. Since the y-axis has the equation x=0, we can plug 0 into the function definition to find the intercept.
Calculator: finding value of a function
SL Core 2.3
On a graphing calculator, you can quickly calculate f(a) for any function f(x) and any a in its domain.
On a TI-84, under Y= set Y1=f(x), then on the home screen type vars > Y-VARS > FUNCTION > Y1, enter Y1(a), and hit enter to see the value of f(a).
On a Casio, from the calculate app, press FUNCTION, choose Define f(x) and input your equation. Then, press FUNCTION again and now press f(x) , and type in the value of a and a close parenthesis. This returns f(a).
Horizontal asymptotes
SL Core 2.3
A horizontal asymptote is a horizontal line that a graph approaches but never actually touches or crosses. It's seen where a function approaches a certain constant value as x gets very large (positive or negative).
Horizontal asymptotes have the equation y=a for some a∈R.
To find a horizontal asymptote with a calculator, plot the curve and use trace to inspect the value of y for large (positive or negative) x.
Vertical asymptotes
SL Core 2.3
A vertical asymptote is a vertical line that a graph approaches but never actually touches or crosses. It's usually seen where a function "blows up," meaning the function’s values become infinitely large or small as you get closer to certain values of x.
Vertical asymptotes have the equation x=a for some a∈R.
Vertical asymptotes occur for functions of the form
f(x)=h(x)g(x)
when h(x)=0 and g(x)=0, as division by zero is undefined, and division by a number close to zero gives a large number.
Maxima and Minima
SL Core 2.4
A curve has local maxima or minima when the curve changes y-direction. This means that a local maximum is greater than the points immediately to its left and right on the graph; likewise, a local minimum is greater than the points immediately to its left and right on the graph.
The global maxima and minima are the overall maximum or minimum points on the curve.
Finding maxima & minima with technology
SL Core 2.4
Graphing calculators can be used to find the coordinates of maxima and minima of a function. On a TI-84, click 2nd > CALC and then either 3:minimum or 4:maximum.
Before trying to find a minimum or maximum, check visually whether the function has the desired extrema.
Domain and range
3 skills
Domain of a function
SL Core 2.2
The domain of a function is the set of possible inputs it can be given.
The "natural" or "largest possible" domain of a function is all the values of x for which the expression f(x) is defined.
Range of a function
SL Core 2.2
The range of a function is the set of possible values it can output.
If the domain of the function is restricted, the range may need to be restricted as a consequence.
Notation for domain and range intervals
SL Core 2.2
The domain and range of functions are commonly intervals of real numbers.
For example, if f(x) is defined for 1<x≤5, we can write the domain
{x∈R∣1<x≤5}
(∈ means "in" or "element of", and R is all real numbers)
We can also use the equivalent interval notation
x∈]1,5]
where, by IB convention, an outward facing [ means that end is not inclusive (1<x) and an inward facing ] means that end is inclusive (x≤5).
Another common interval notation is
x∈(1,5]
where ( indicates a non-inclusive endpoint and ] indicates an inclusive endpoint. In this style, all brackets are inward facing.
These can also be visualized on a number line:
Function Composition
1 skill
Composite functions
AHL AI 2.7
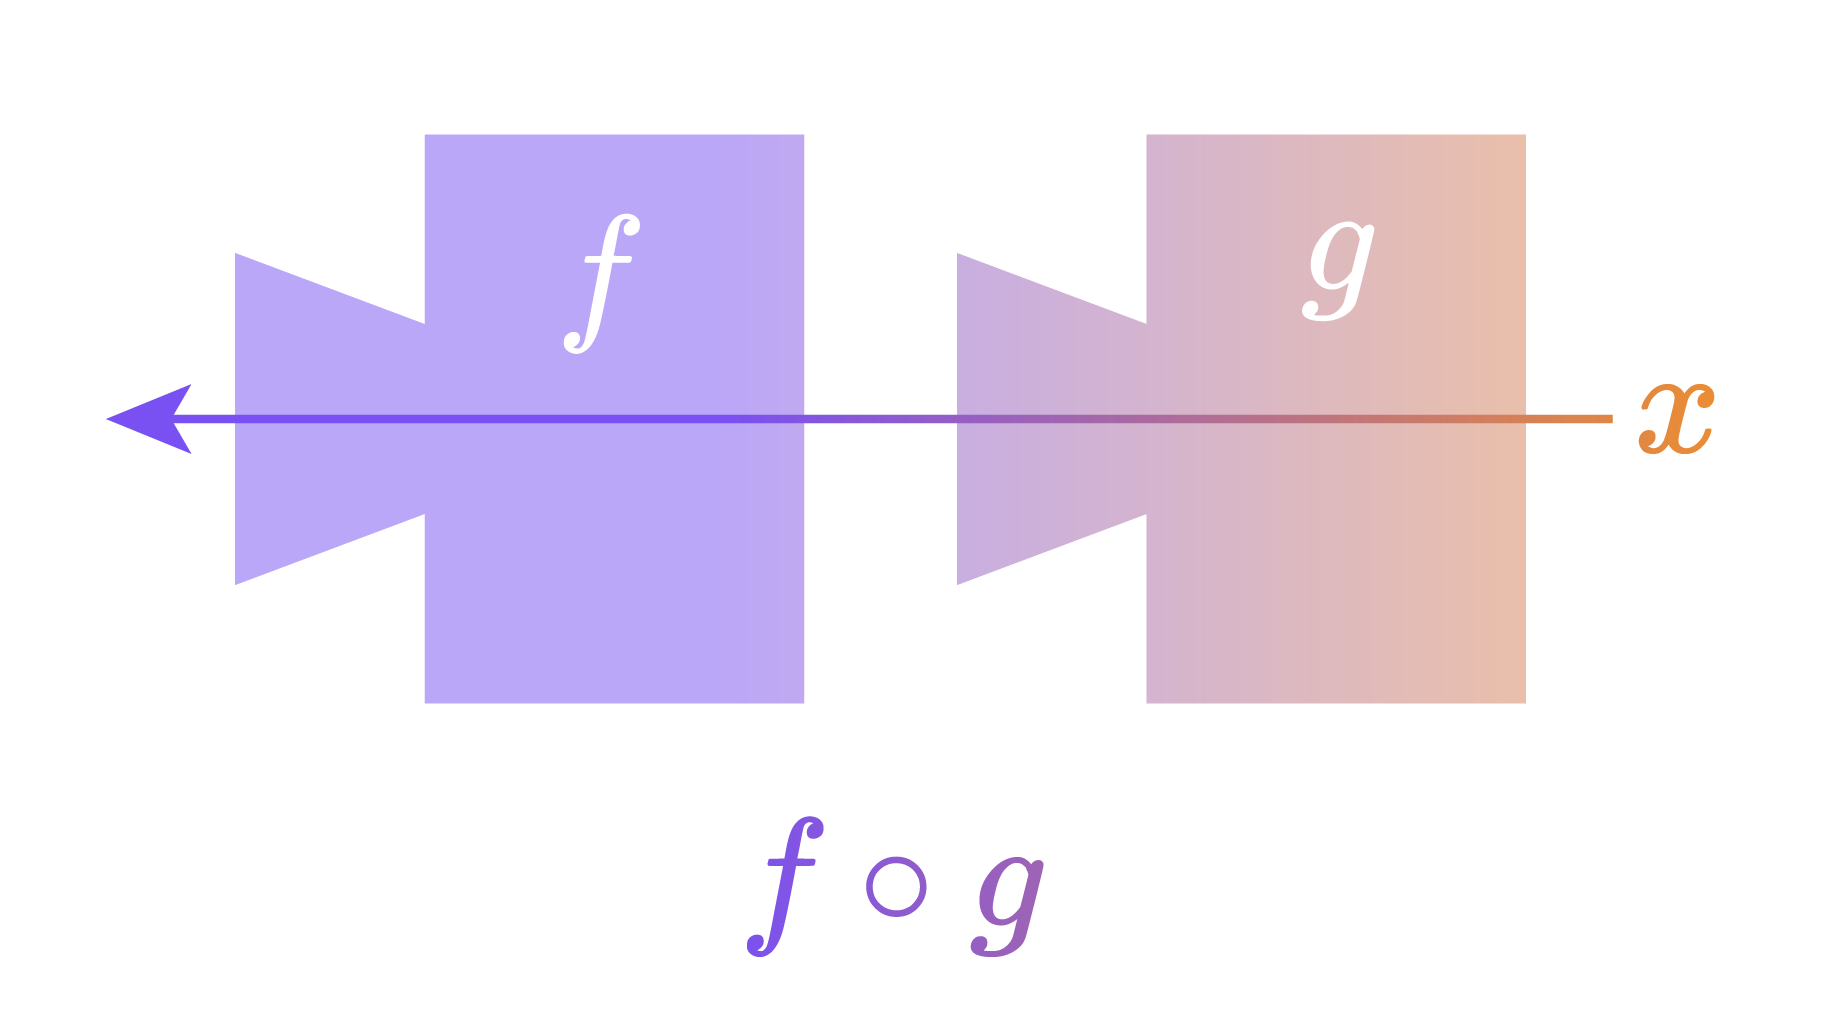
Functions can be composed by passing the output of one into the other. We use the symbol ∘, and pay close attention to the order in which functions are composed:
(f∘g)(x)=f(g(x))🚫
To find an expression for f(g(x)), substitute g(x) for x in the expression for f(x).
Notice that for (f∘g)(x), we first pass x into g, and then pass that output into f.
Inverse Functions
4 skills
Finding inverse of specific value
SL Core 2.2
We can find x=f−1(b) by applying the function to both sides:
f(x)=f(f−1(b))=b
So finding f−1(b) is equivalent to solving f(x)=b.
Graphically, find f−1(b) is equivalent to being given y=b, and finding the value of x for which that is true:
Graphs of inverse functions
SL Core 2.2
The graph of a function f shows all the points (x,f(x)). Since f−1 undoes f, its graph will show all the points (f(x),x). In other words, the x and y values are swapped.
This is equivalent to reflecting the curve y=f(x) in the line y=x:
Domain & range of inverse functions
SL Core 2.2
Since f−1 undoes f, the domain of f−1 is all the possible values f could output. That is, the domain of f−1 is the range of f.
The range of f−1 is all the possible values that could have gone into f. Thus, the range of f−1 is the domain of f.
Inverse applied to function is identity x
AHL AI 2.7
Formally, the inverse function is such that
(f−1∘f)(x)=(f∘f−1)(x)=x
We call x the identity function, as I(x)=x composed with any function gives the same function.